Market, territory, product, store, rep. One scoreboard.
When you sell through territories, reps, and stores at once, performance lives in five different spreadsheets. Plunk builds the scoreboard from orders and activity directly: every market, every territory, every product line, every store, every rep, against targets, on the same page.
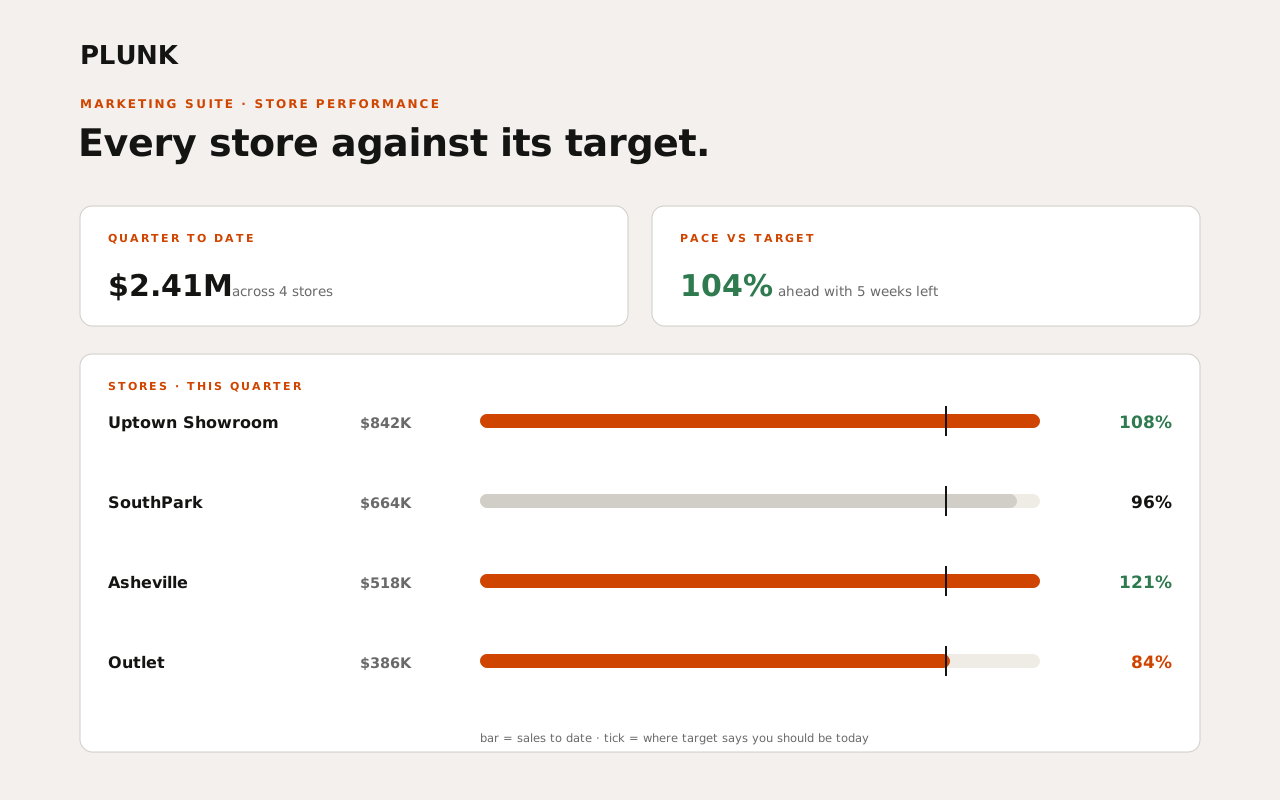
Every store against its target
Store-level revenue, orders, and trends against the targets you set. The store that is quietly slipping shows up while the quarter can still be saved, and the one outperforming shows you why.
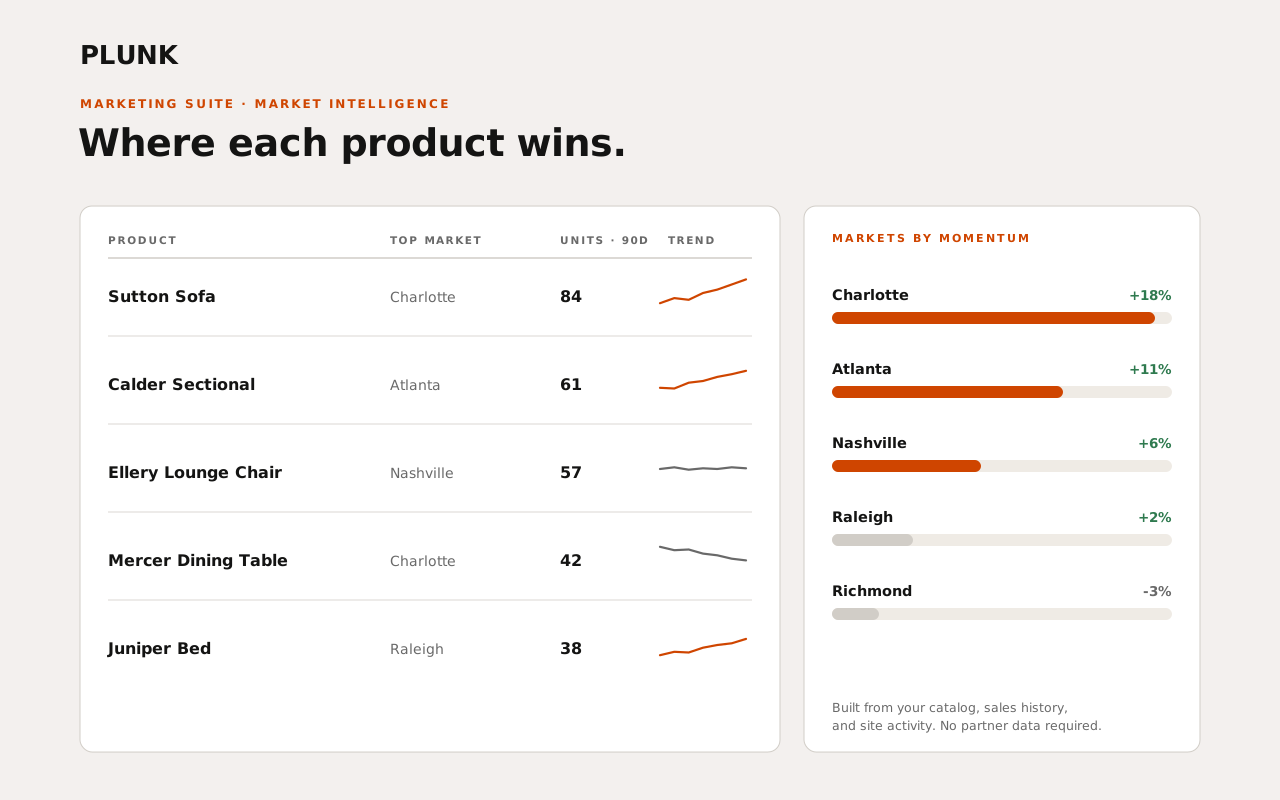
Where each product actually wins
Product performance cut by market and territory: what sells where, what never moves in a region, and which markets are underweighted for a line that wins everywhere else. Range and pricing decisions get a map instead of a hunch.
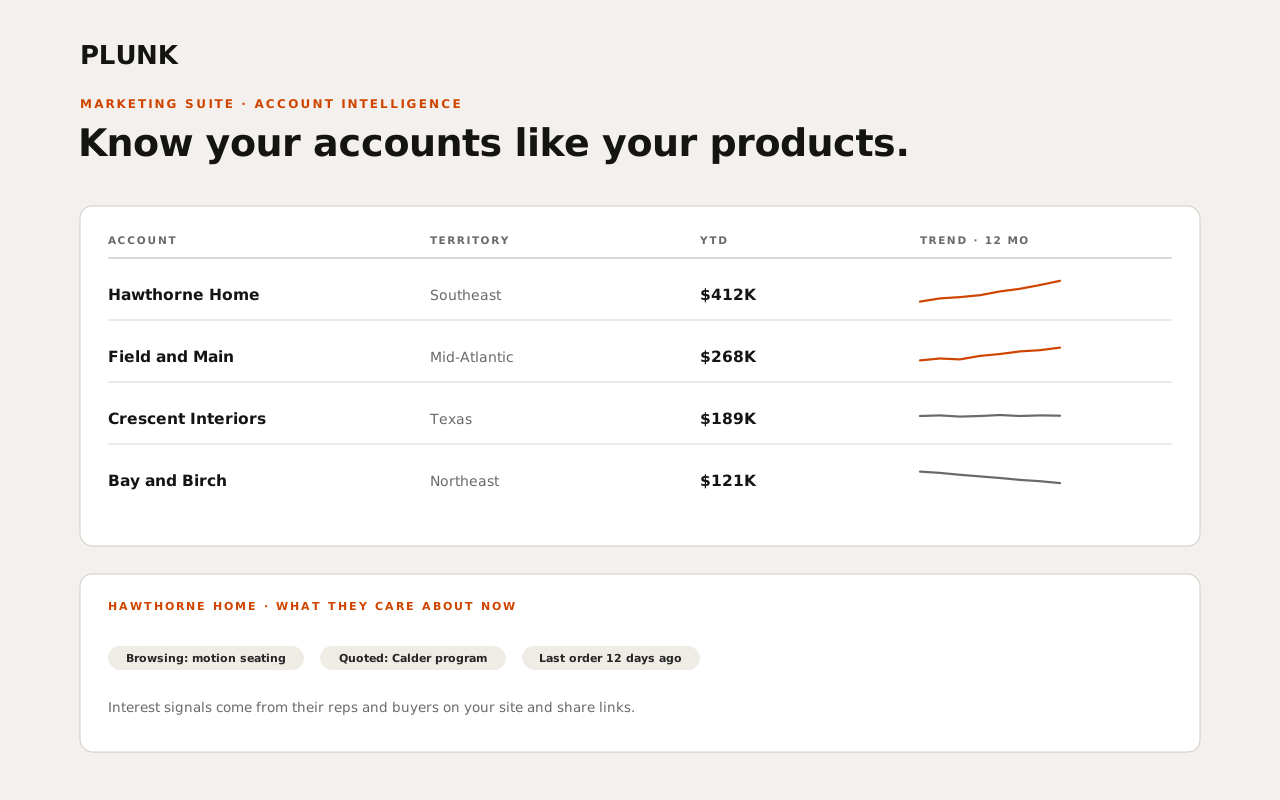
Reps and territories, measured on the same rail
For manufacturers, the same scoreboard rolls up by rep and territory: account coverage, order flow, and the accounts drifting toward lapse in each patch. Reviews run on shared numbers, not competing spreadsheets.
Bring your five spreadsheets.
Markets, territories, products, stores, reps. We will show you the same answers on one page, from your own orders.